See how ADT works.
One step at a time.
Follow the actual desktop software as it researches a stock, checks a budget and records a purchase and sale. This guided example uses a simulated $10,000 account.
Start with your budget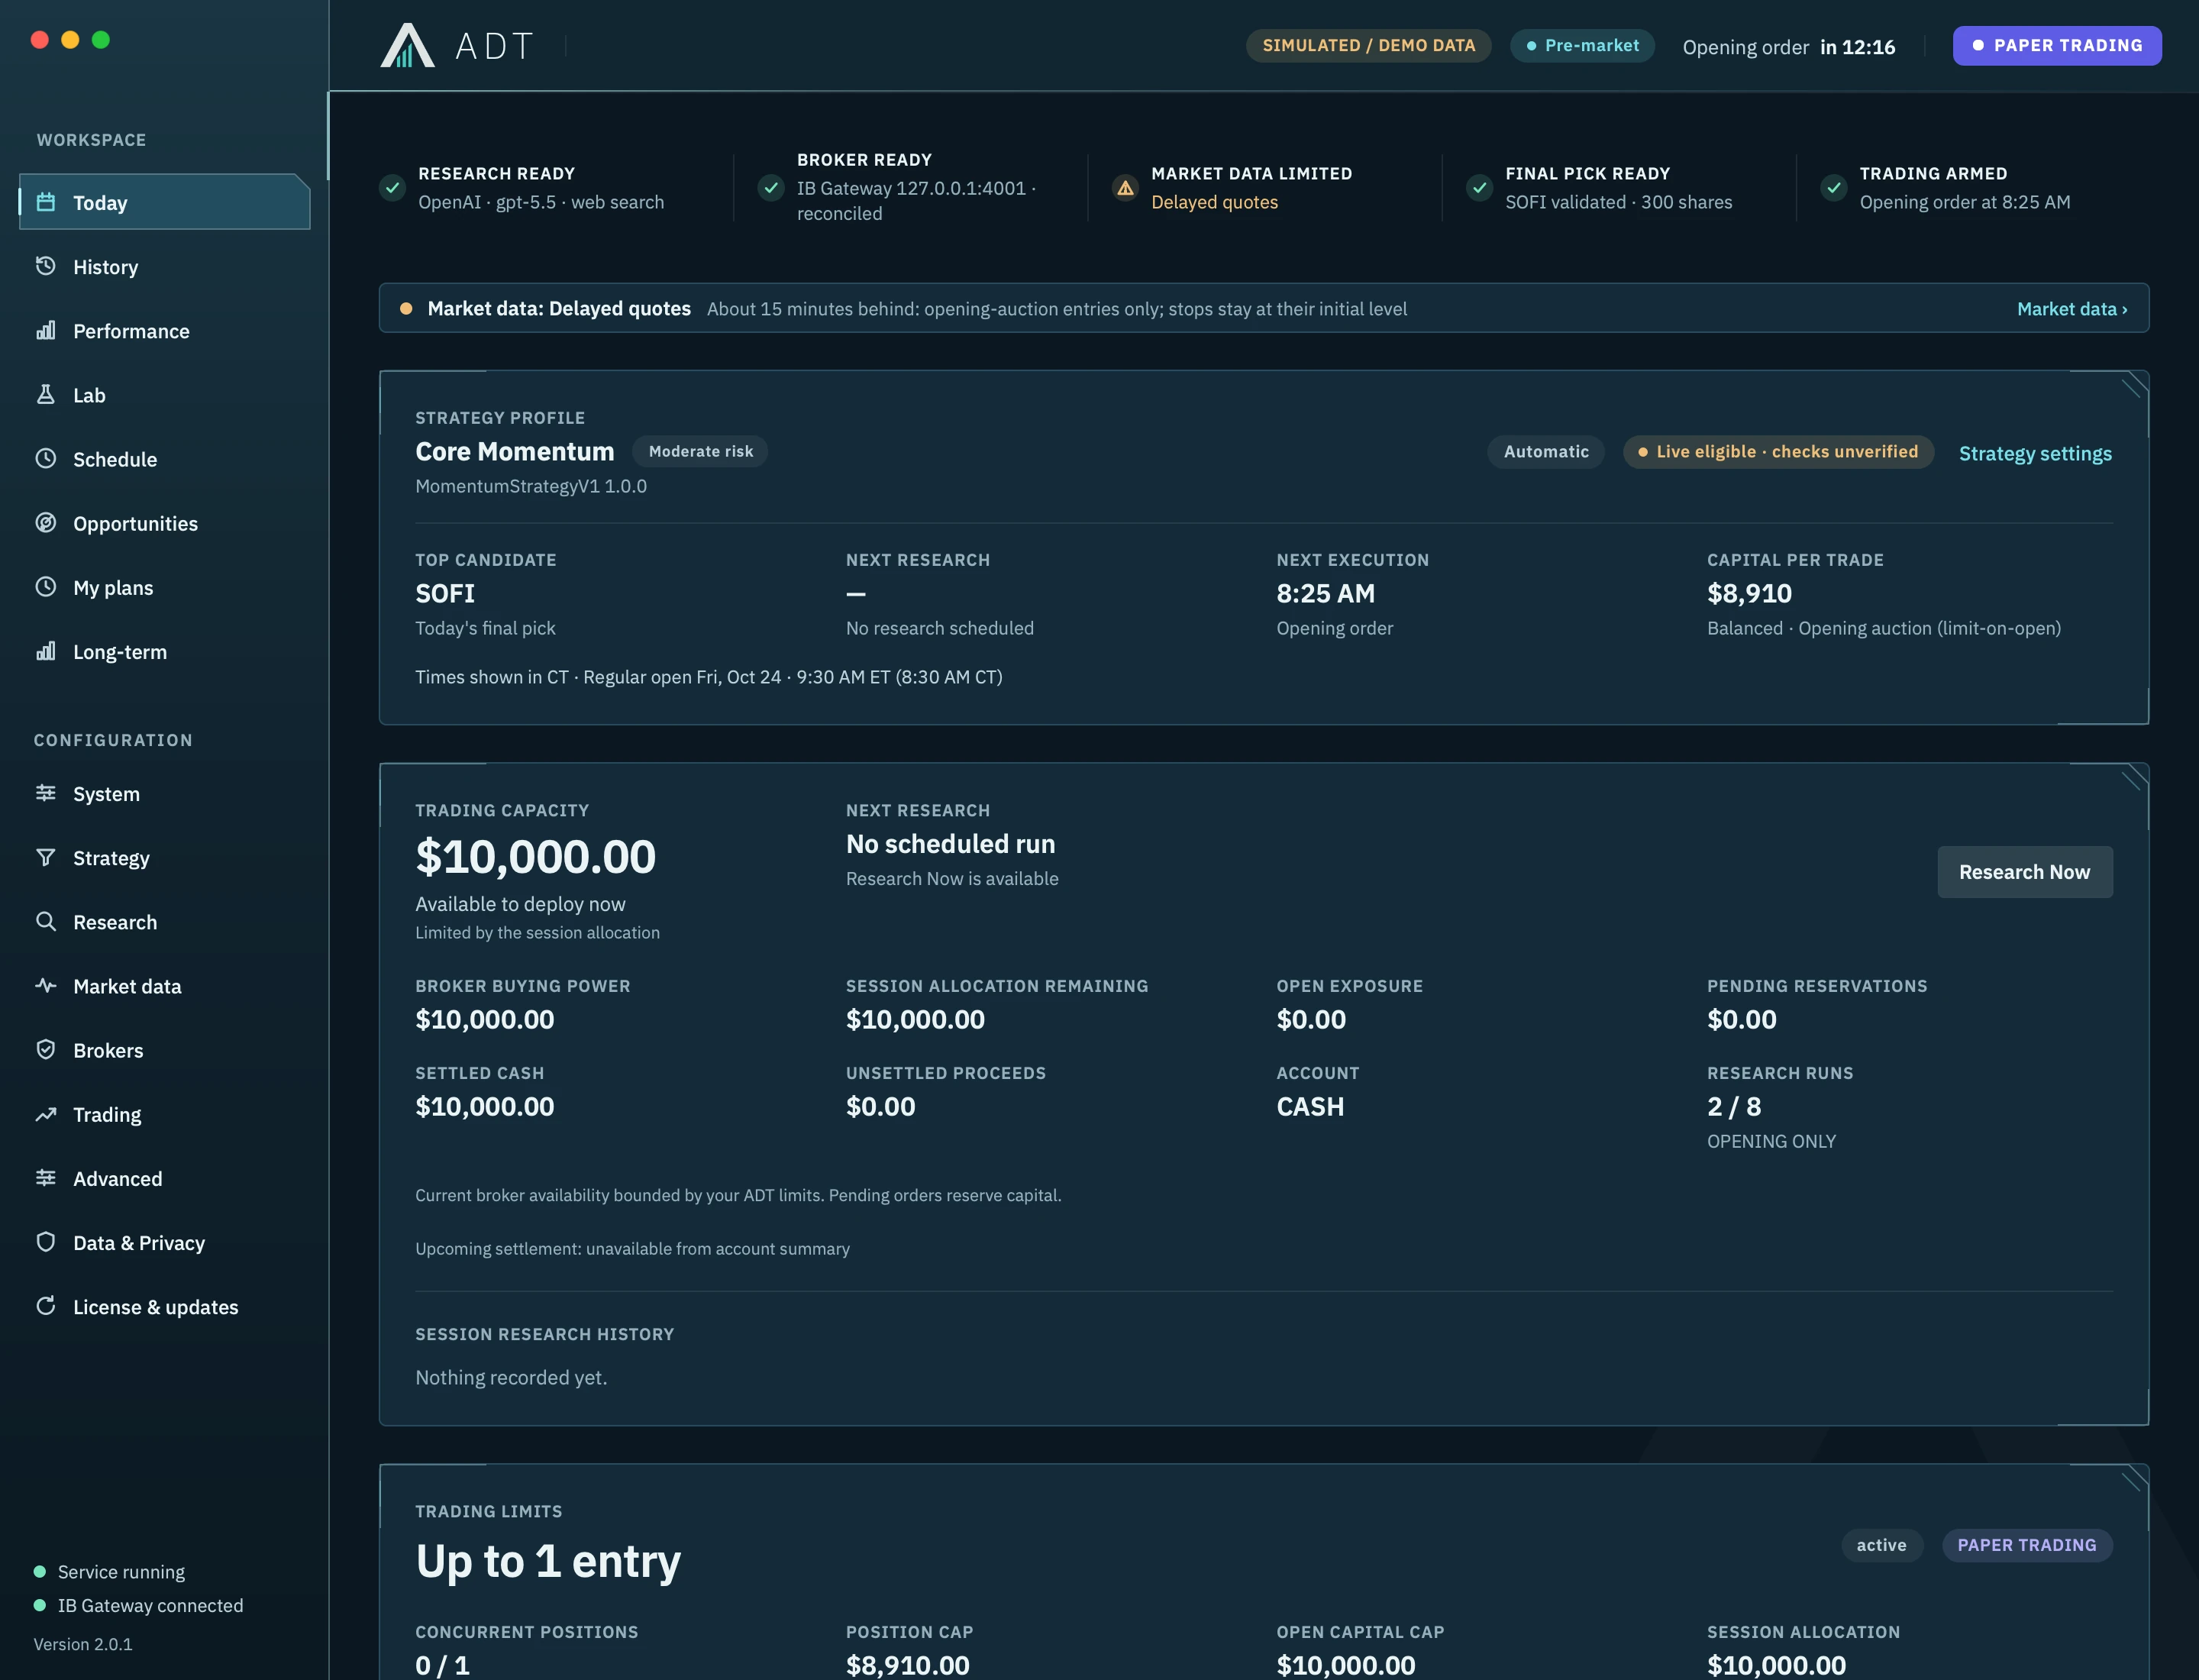 Actual ADT interface Full screen
Start with the money available and the limits you choose.
The account has $10,000 available. ADT checks available cash, your spending limits and any pending orders before a purchase.
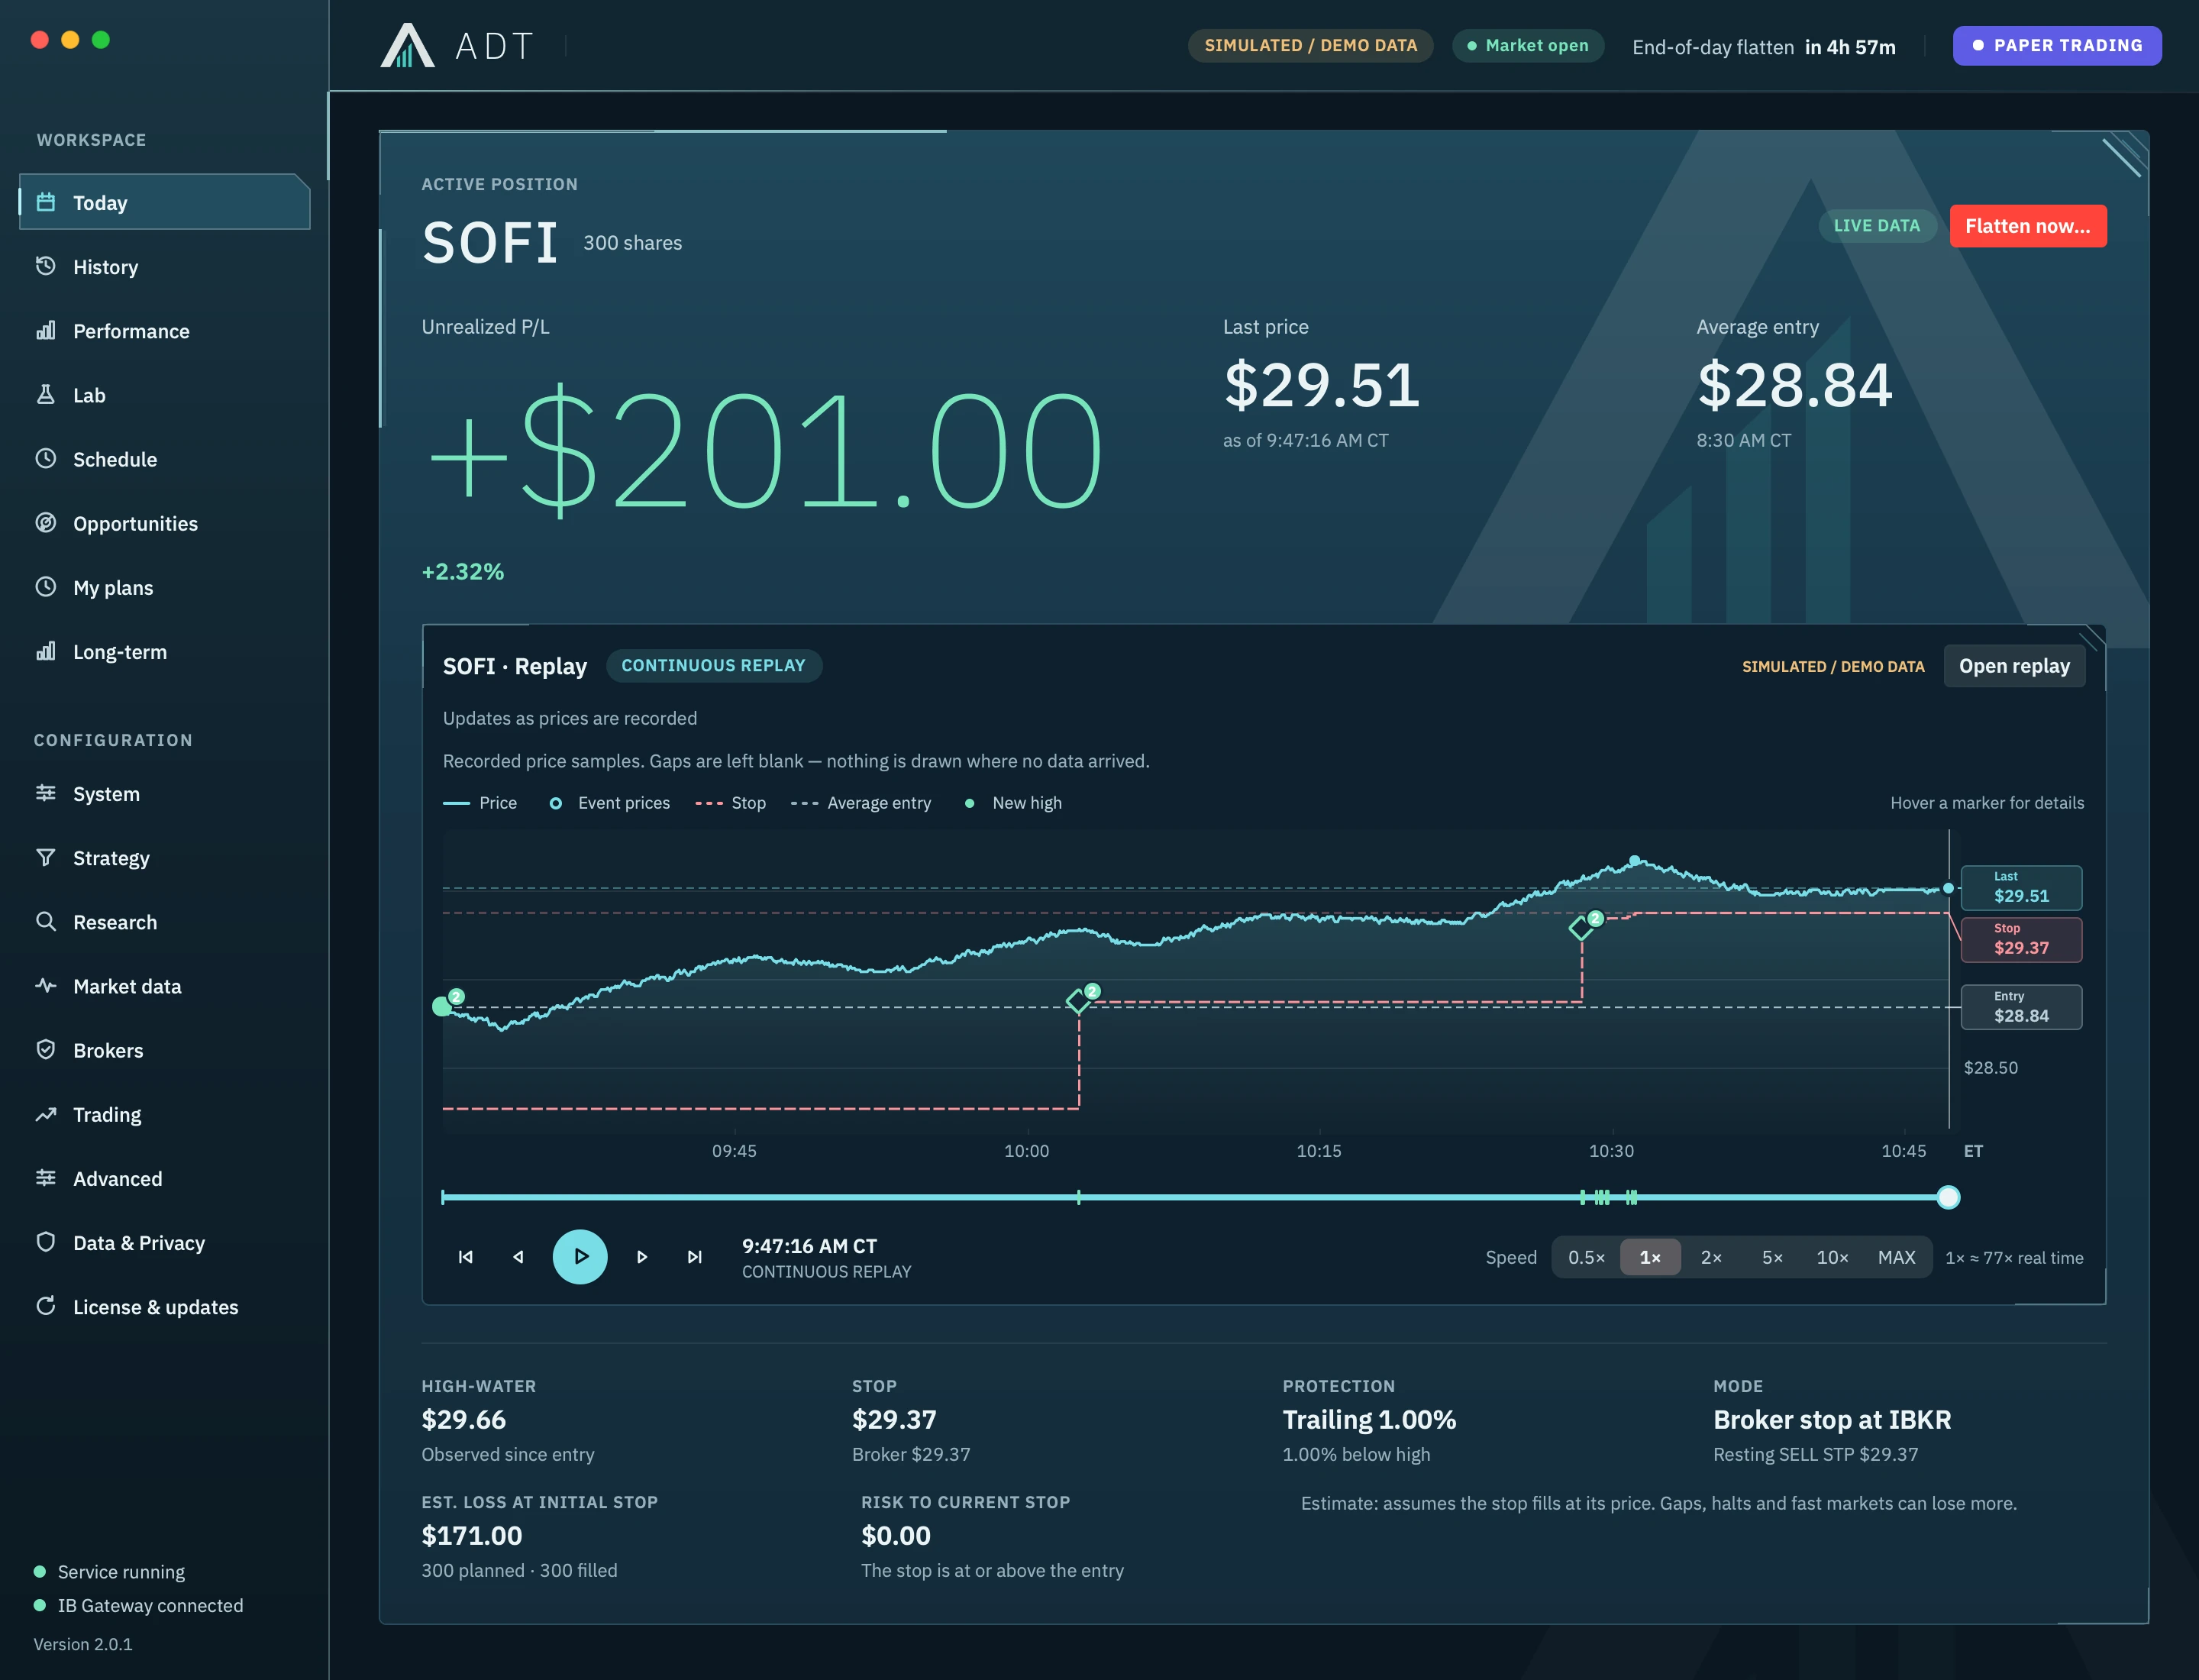 Actual ADT interface Full screen
See the shares you hold and the selling rules.
This example holds 300 SOFI shares bought at $28.84. At an illustrative $29.51, the open gain is $201. The shares have not been sold, so this gain can still change.
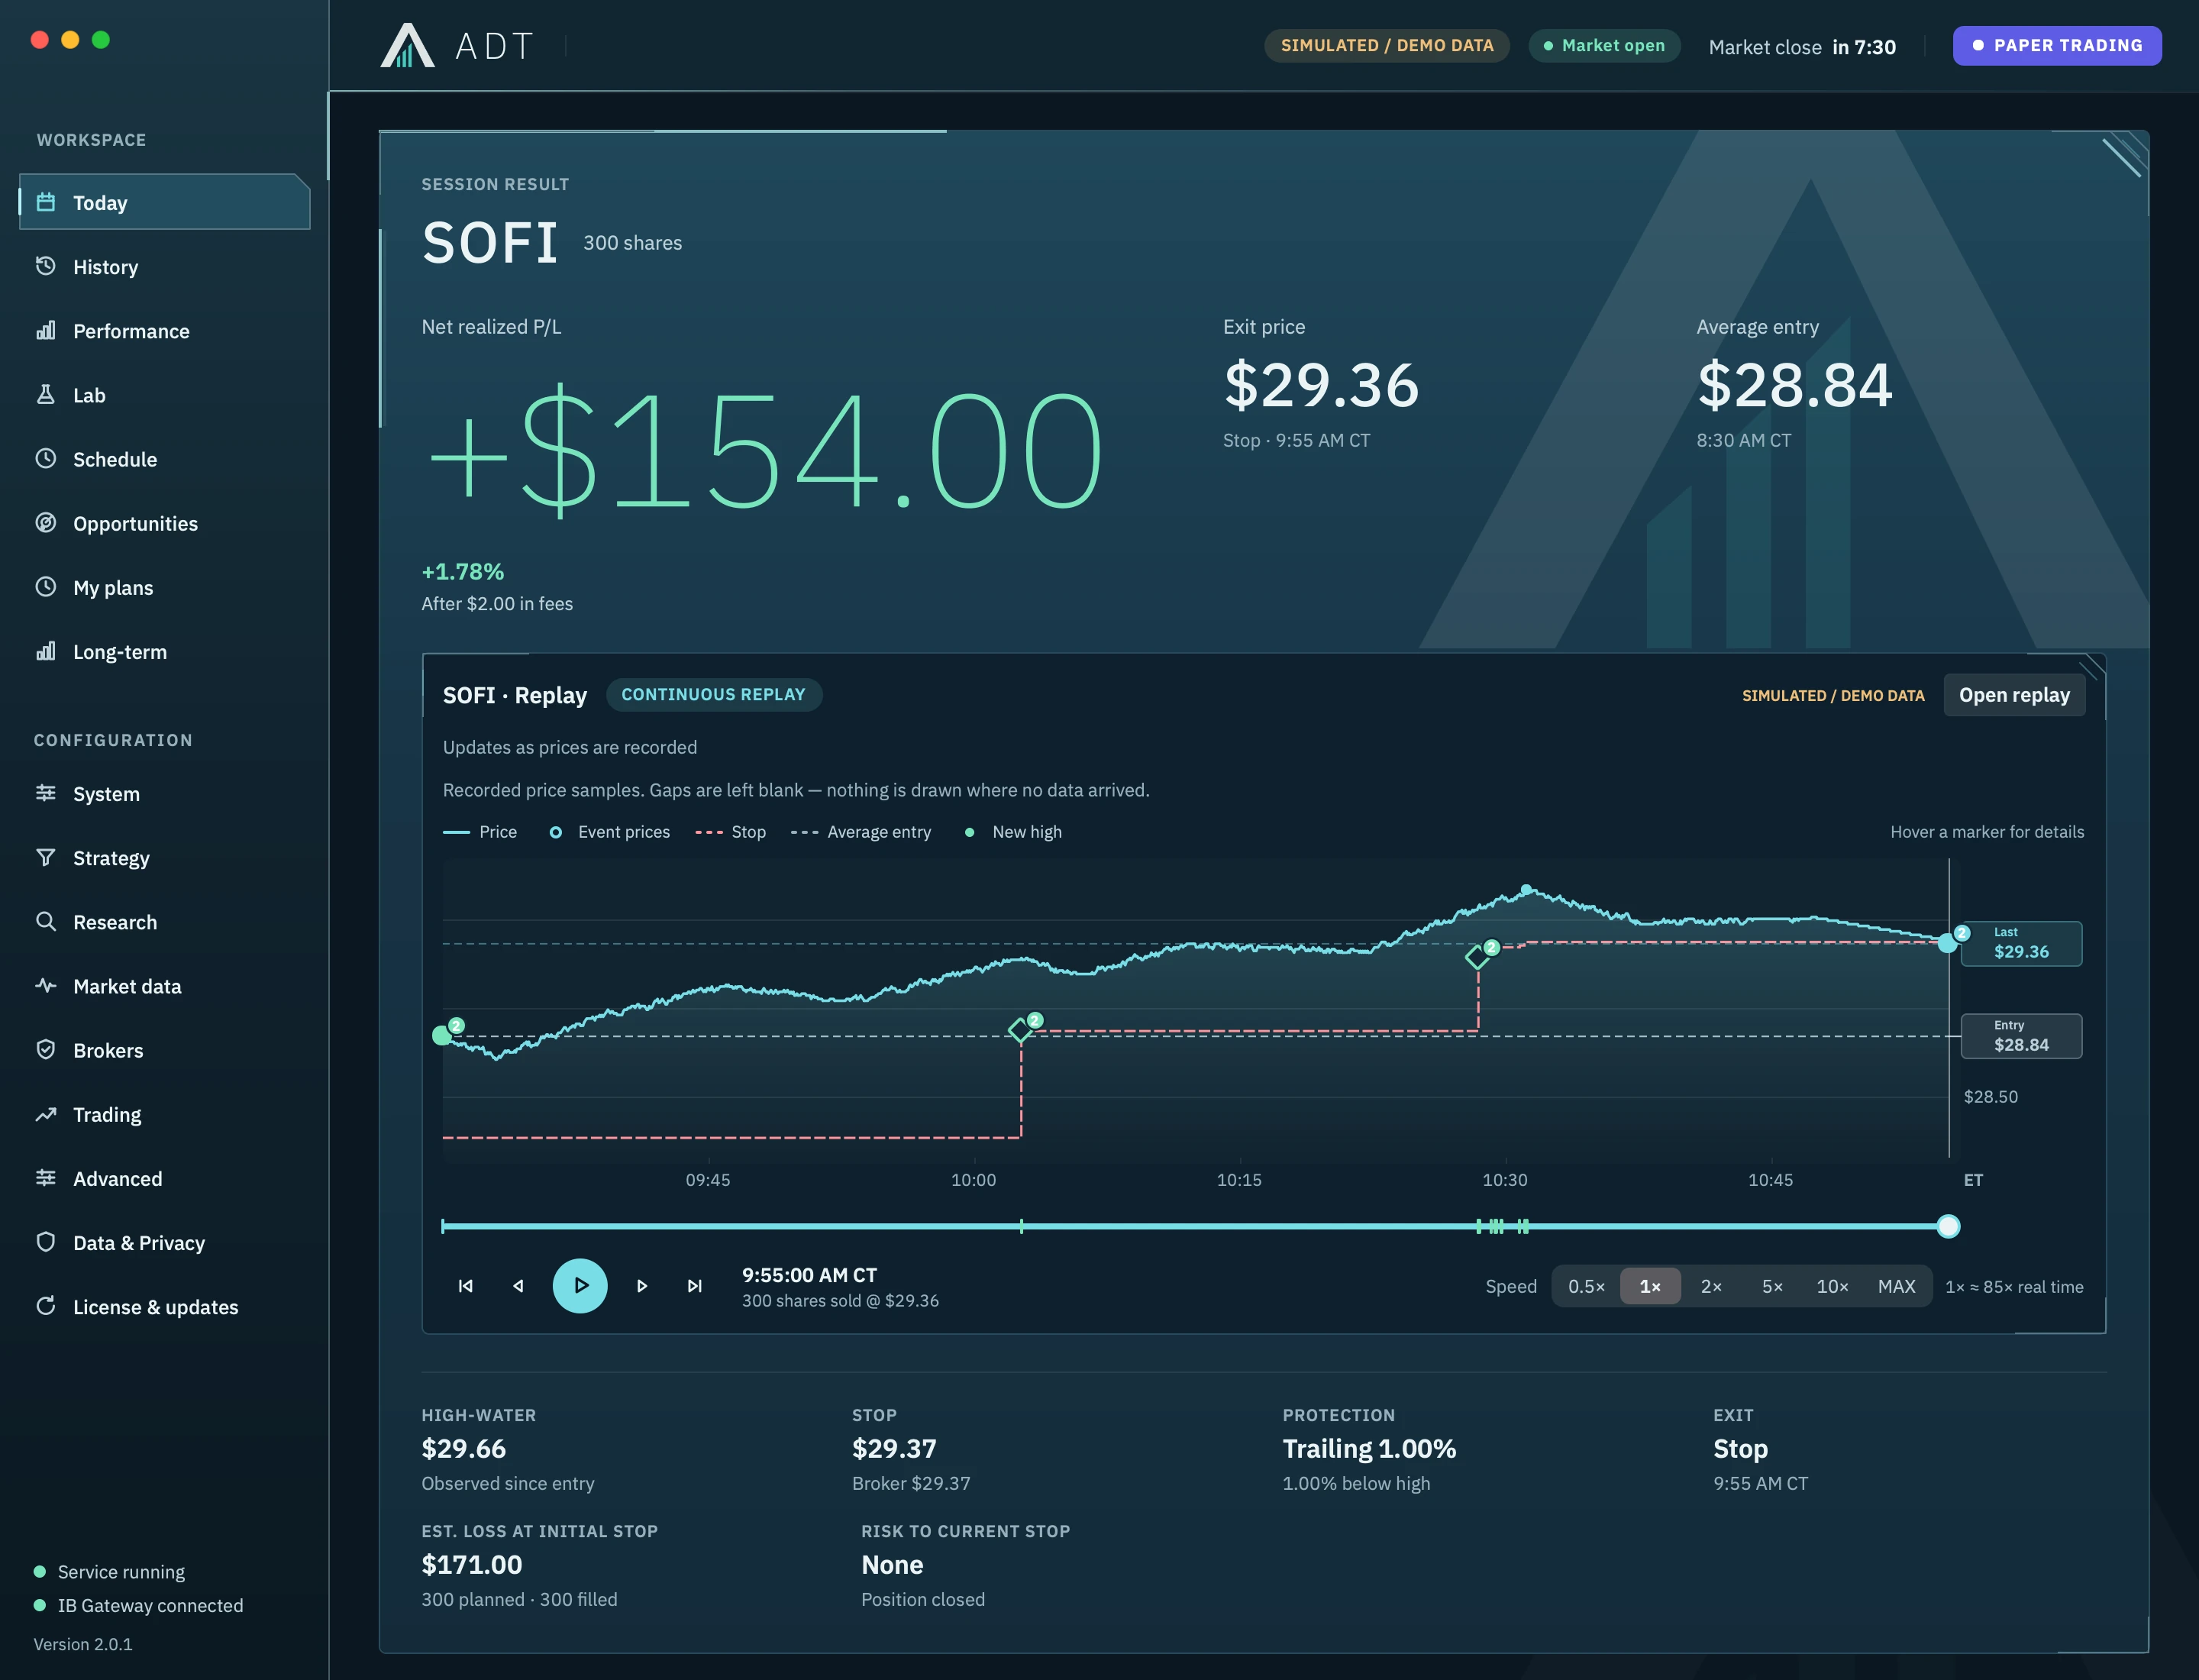 Actual ADT interface Full screen
Review the sale price and the fees.
A simulated sale at $29.36 produces $156 before fees. After $2 in assumed total fees, the example records $154 net. The sale completes one cent below the stop price.
Actual ADT desktop software with simulated money. The browser subscription has a different layout and feature set. Historical price reference; simulated trades and intraday path.
Choose a budget.
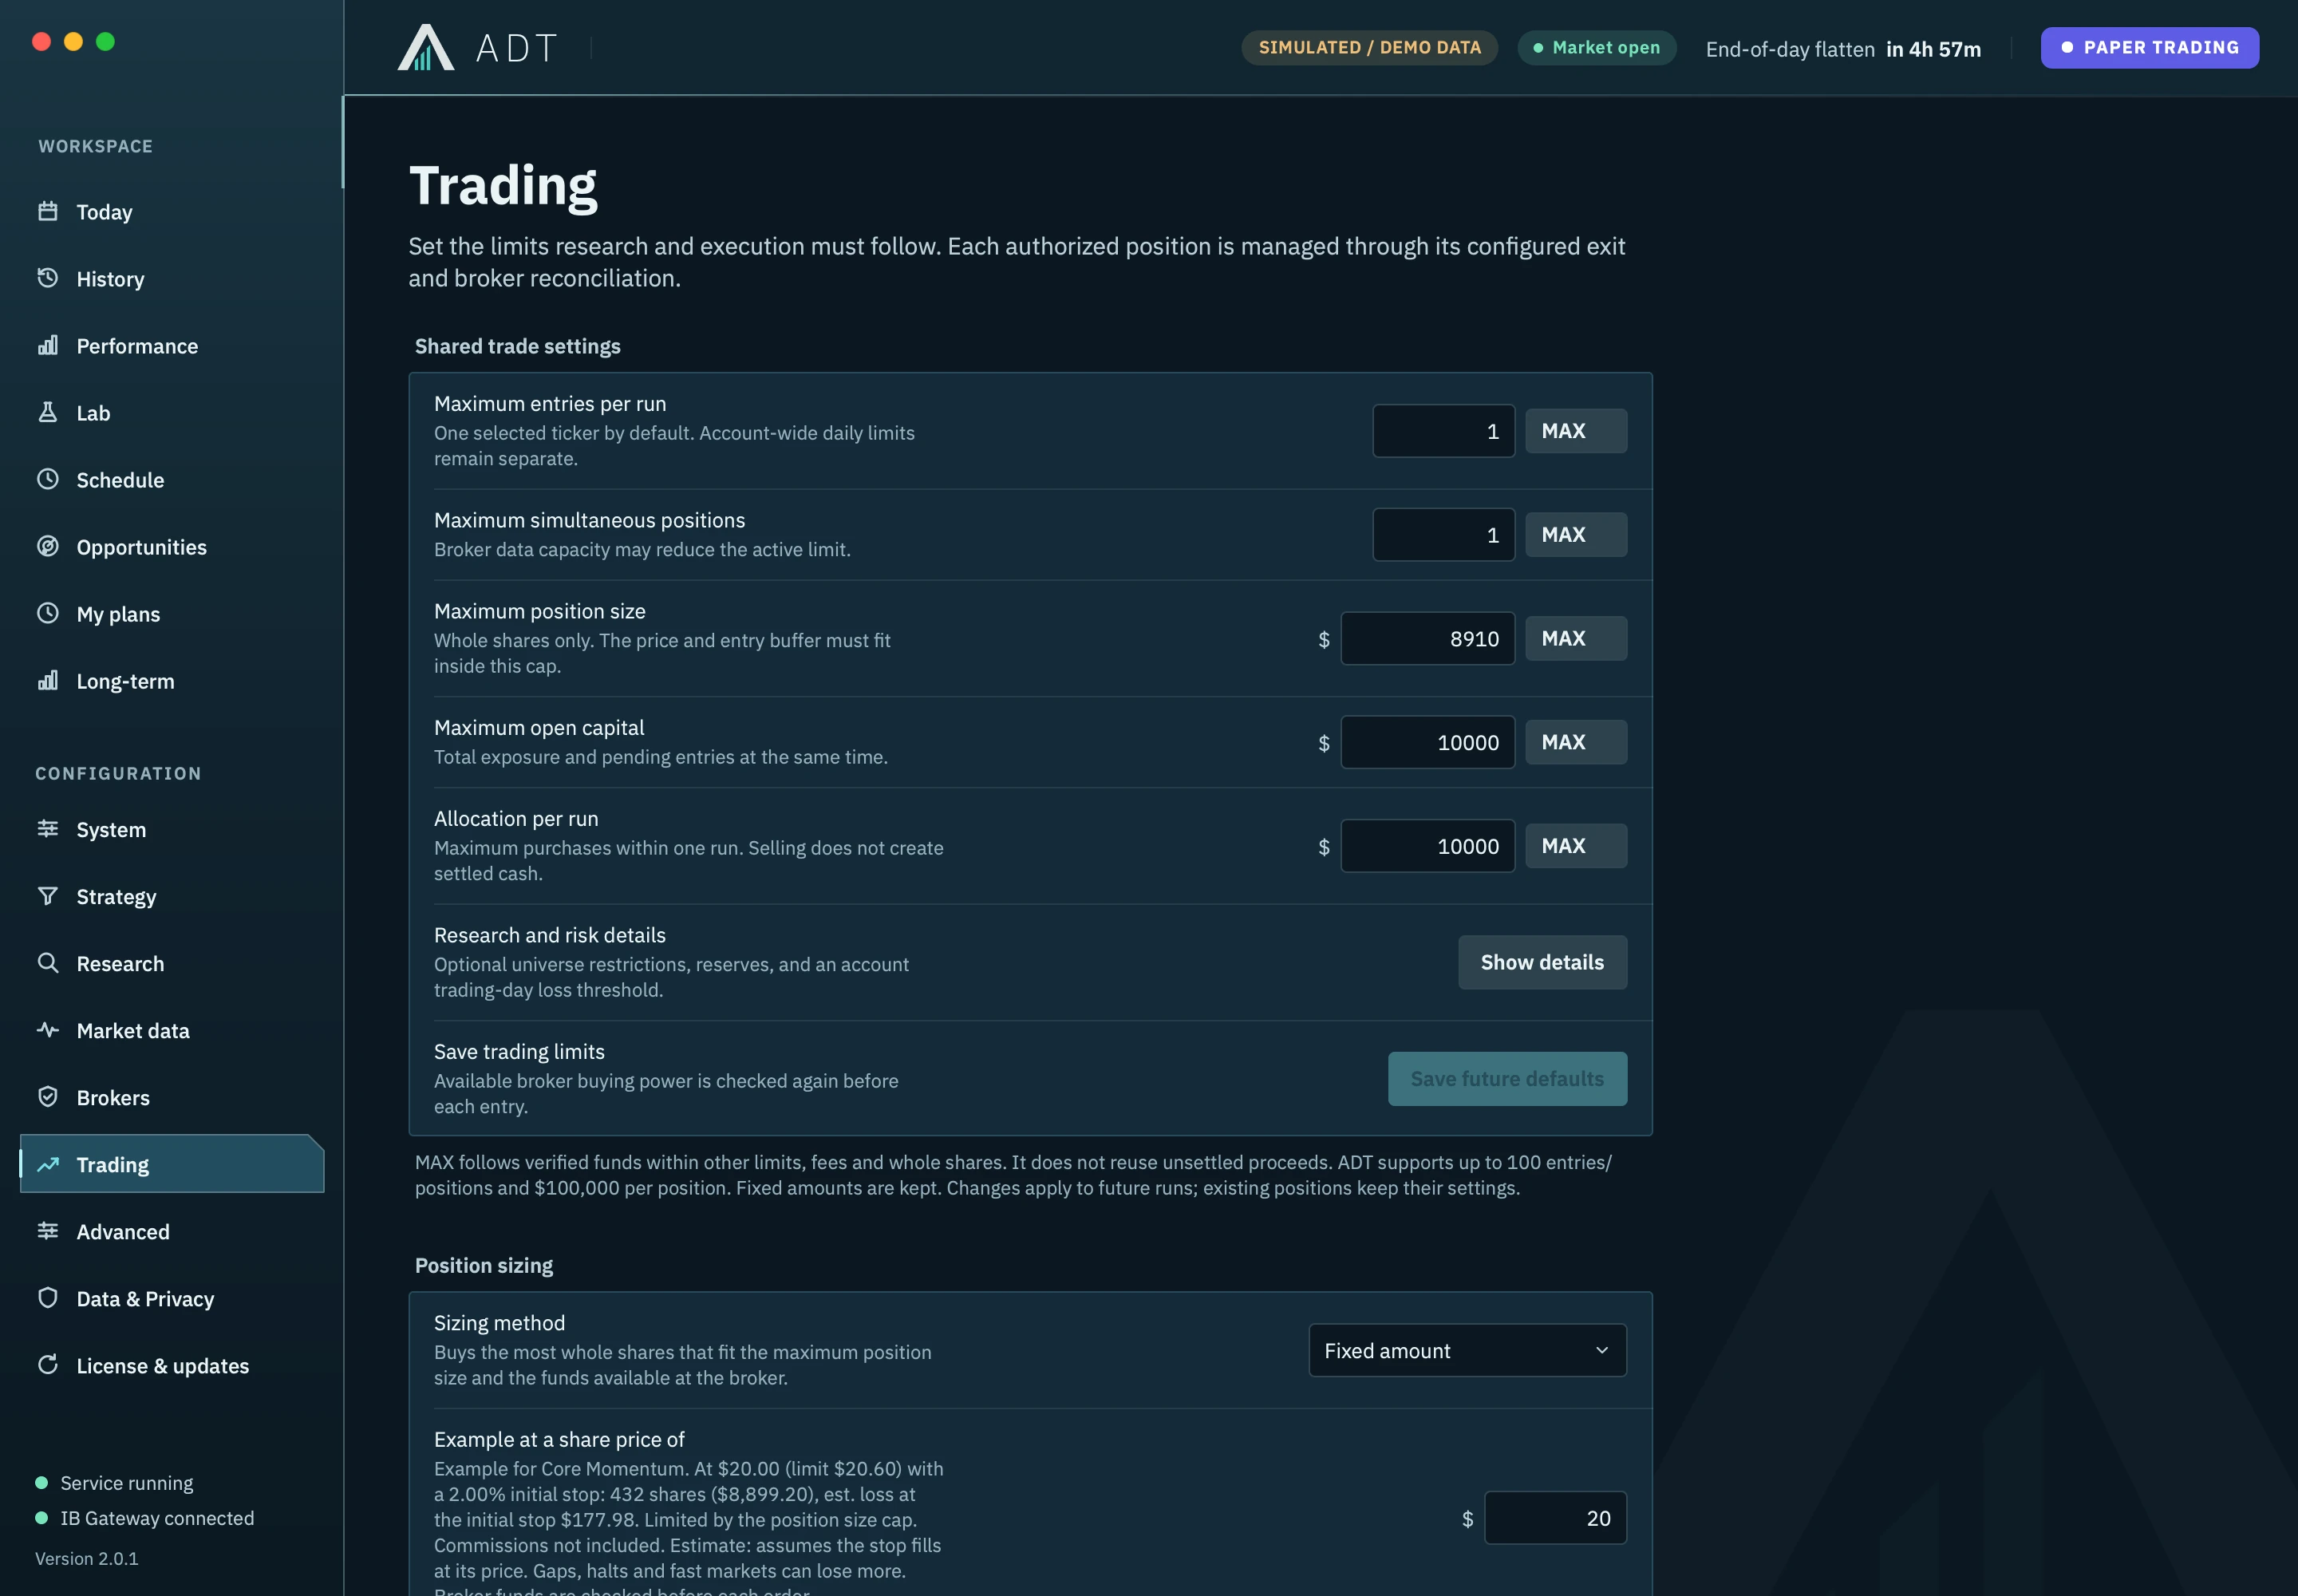
Set a purchase limit.
You decide how much ADT may use for one purchase and across all trades. A brokerage account holds your trading money; your ADT budget can be smaller than that account’s balance.
Where the $10,000 went
Immediately after the example purchase- Purchase cost
- $8,652
- Cash remaining
- $1,347
- Assumed entry fee
- $1
See why a stock
was selected.
A stock symbol is a company’s market abbreviation, such as SOFI. ADT shows the research behind an idea, then checks the current price, your budget and permission before a purchase.
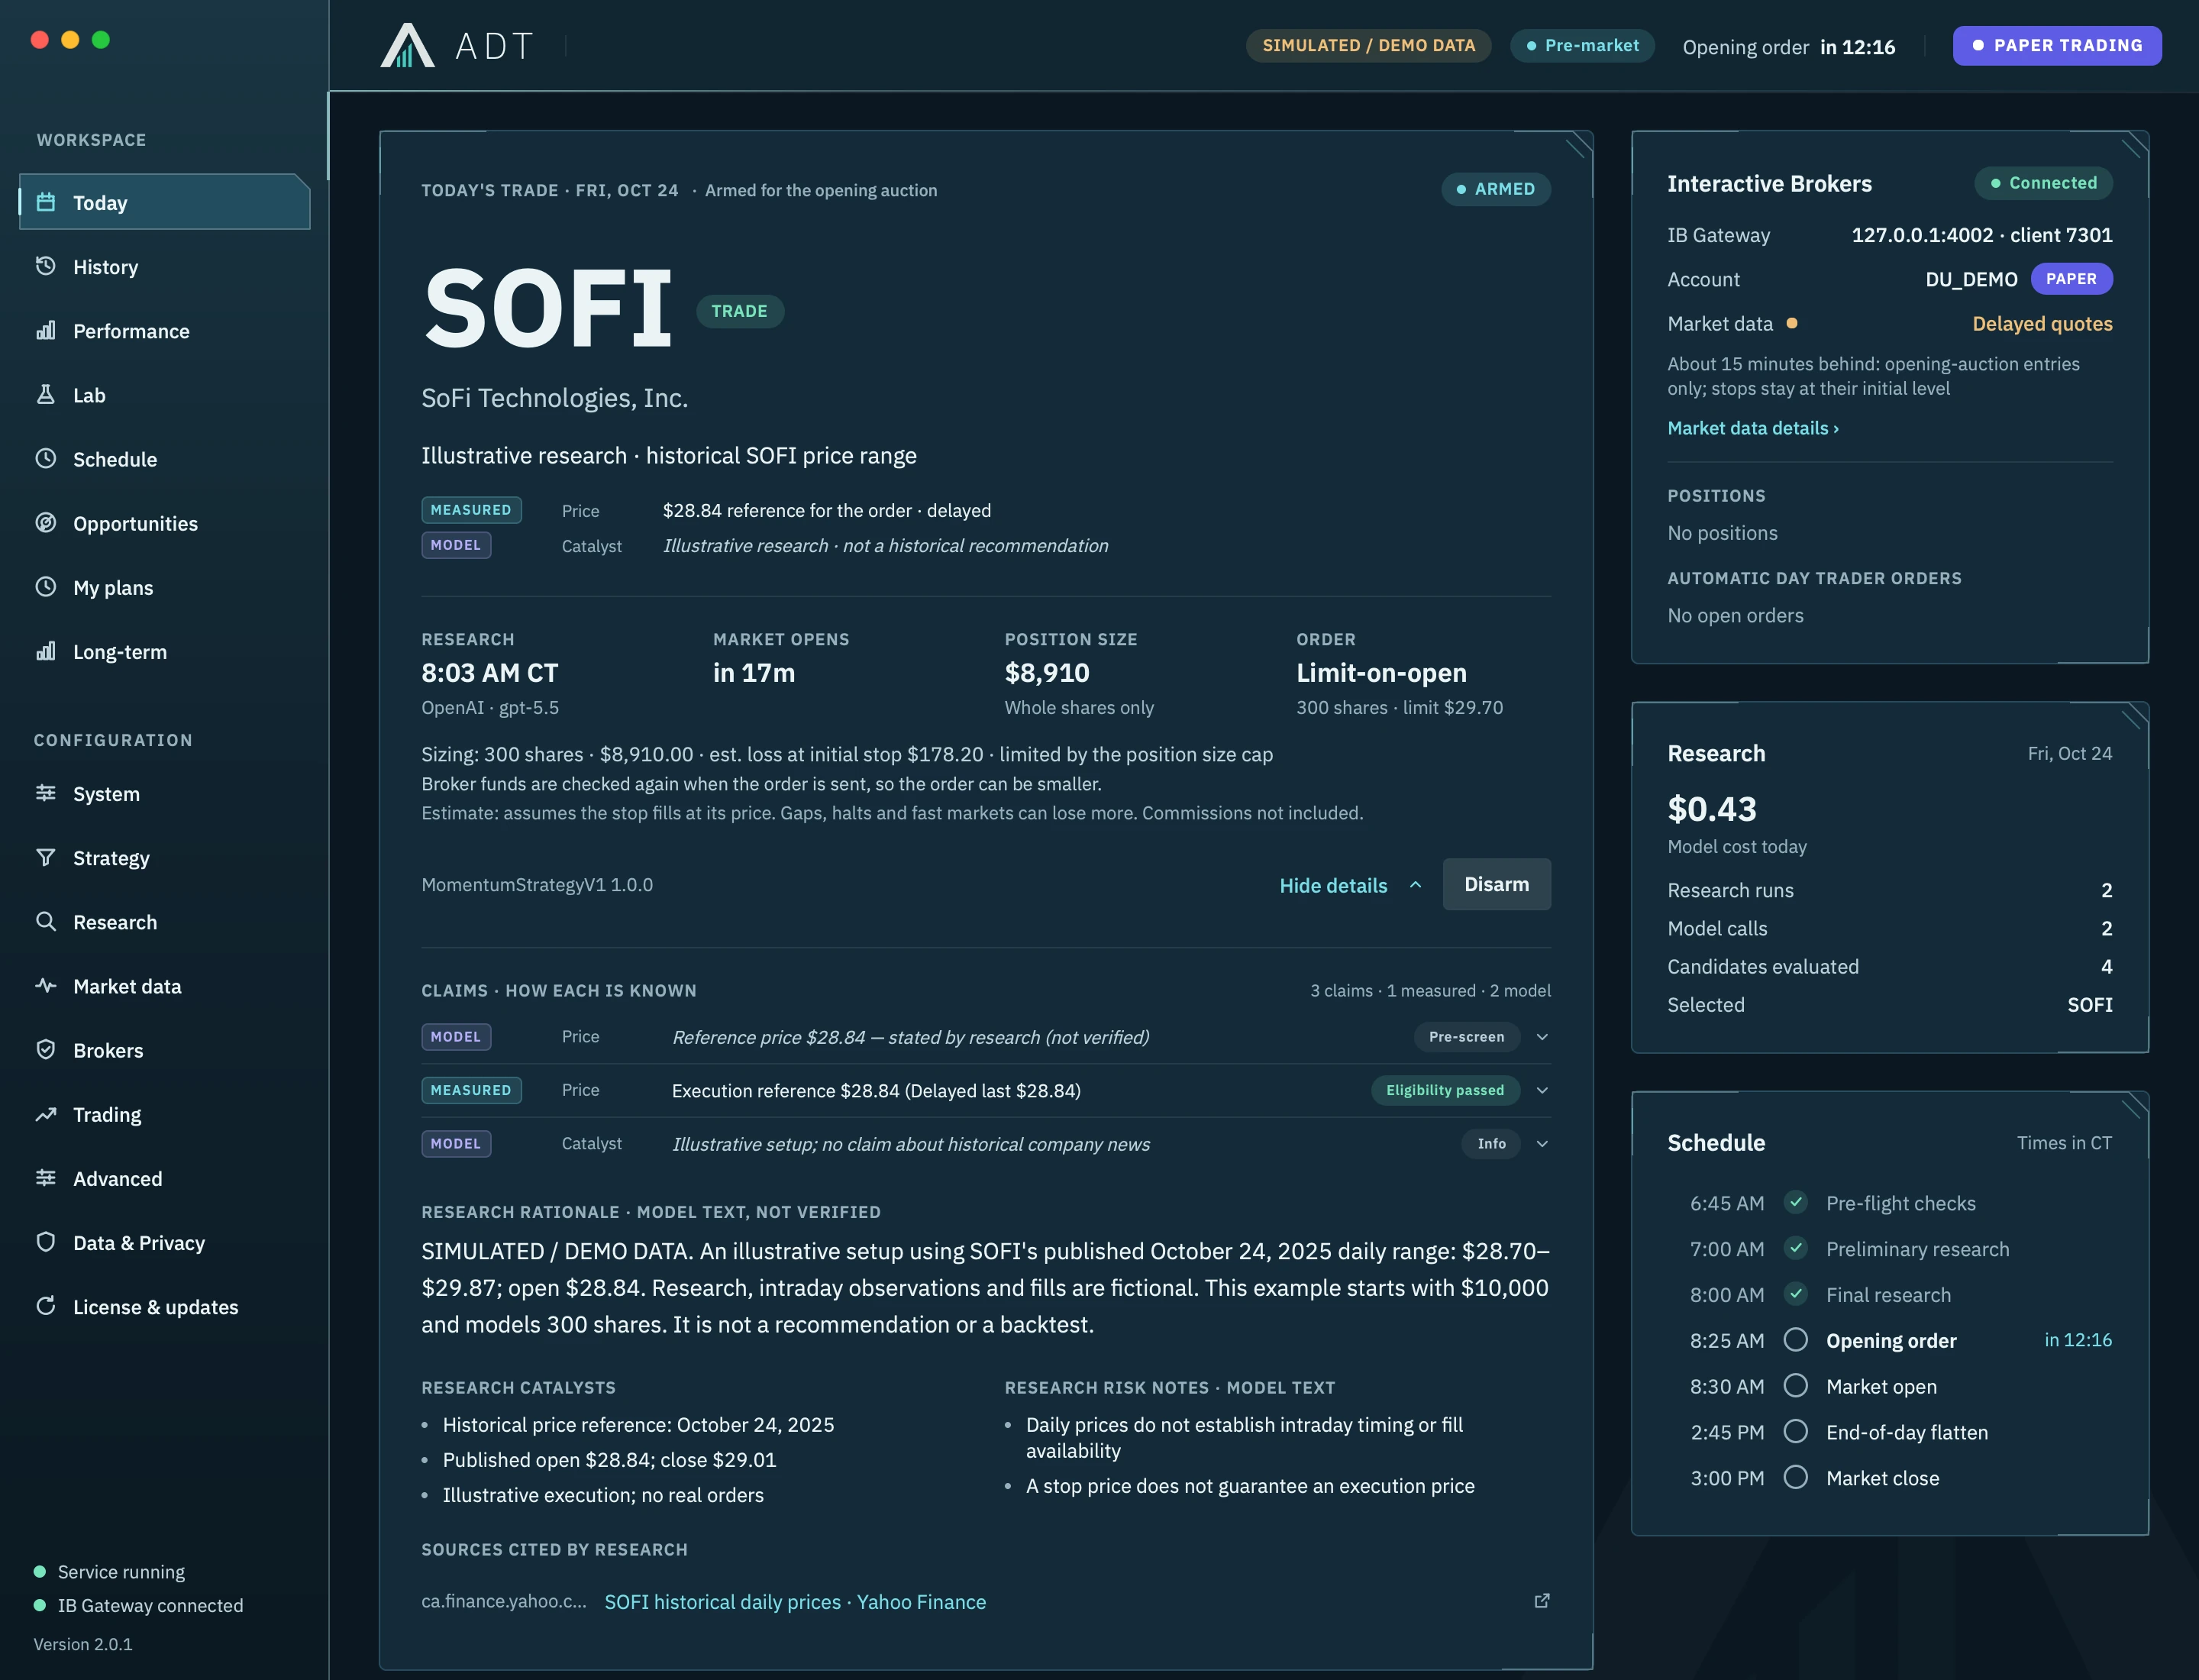
Read the reasoning.
Read the explanation and where the information came from. Research can be wrong or become outdated.
Check your boundaries.
An idea may fit one person’s budget and price range but fall outside another’s.
You decide whether it may trade.
Creating an account or paying a subscription does not give permission to use real money.
Follow the shares
you now own.
Shares you hold are called a position. The chart shows their price, what you paid and the configured stop—a request to sell if the price reaches a set level.
A stop is an instruction, not a guaranteed price. Gaps, halts, unavailable data and broker problems can delay an exit or produce a larger loss. Understand the controls
See what the sale
actually returned.
A gain shown before you sell can still change. After a sale, ADT records the purchase price, sale price and fees. This example sells one cent below the stop price.
Real interface.
Referenced prices.
Simulated account.
SOFI’s published daily prices for October 24, 2025 were open $28.84, high $29.87, low $28.70 and close $29.01. The example’s price observations stay inside that range.
The intraday path, timestamps, research, fills and $2 fee assumption are illustrative. Daily prices do not prove those fills were available or that ADT made this trade. Simulation does not predict future returns.
Choose the ADT setup
that fits your needs.
The dedicated ADT computer starts at $6,449. The planned browser service is $199 per month, for supported U.S. stocks during regular market hours.
Account sign-in is available. Paid subscriptions and real-account trading are not open yet.